
Residential sales value
AED 70.4 billion
Emirate-wide transaction value in H1 2026; AED 25.3 billion in H1 2025.
 Illustration
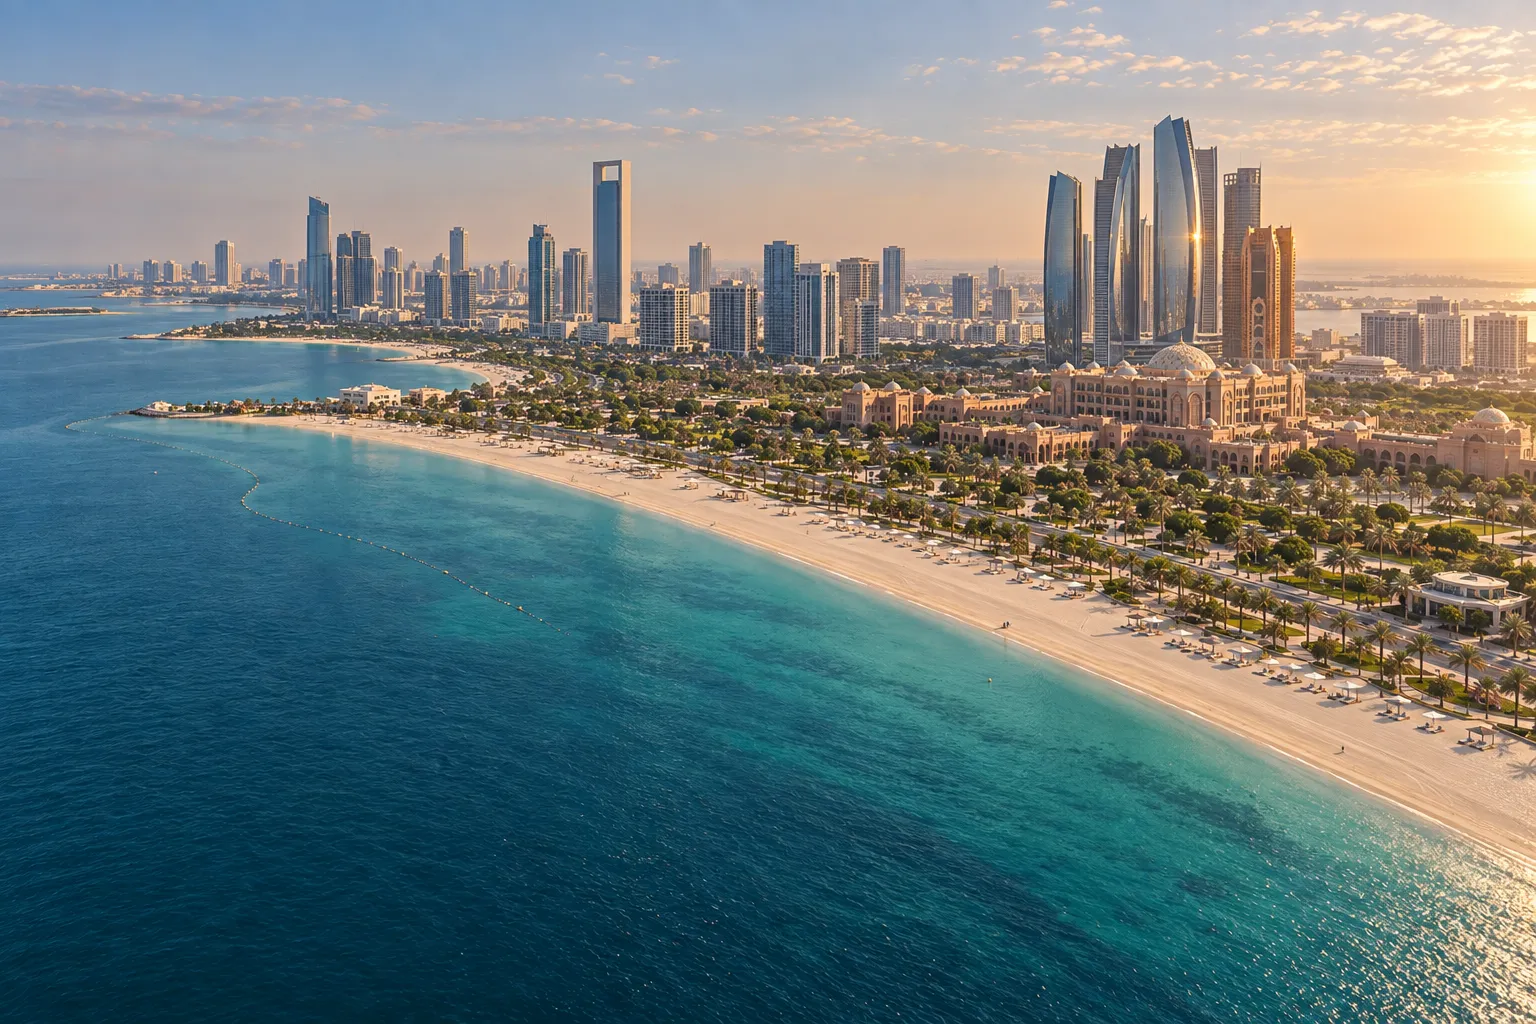
UAE capital; key areas include Saadiyat Island, Yas Island and Al Reem Island
UAE capital with several established premium property districts
Request a personalised shortlistMarket data
For Abu Dhabi, ADREC’s latest official report, covering the first half of 2026, examines the residential market across the entire emirate. Residential sales totalled AED 70.4 billion; off-plan property accounted for 89% of this value, so the figure should not be treated as a measure of completed-apartment pricing. The repeat-sales indicator shows apartment prices rising by 20% and villa prices by 12% year on year. ADREC’s release does not provide a single purchase price, price per square metre or gross yield, so no such Abu Dhabi-wide average is shown here. Project- or island-level opportunities require separate assessment.
Data scope
Entire Emirate of Abu Dhabi; transaction value includes completed and off-plan residential property, while the price-movement indicators contain separate apartment and villa series.
Period covered
1 January–30 June 2026; year-on-year comparison: H1 2025
Residential sales value
AED 70.4 billion
Emirate-wide transaction value in H1 2026; AED 25.3 billion in H1 2025.
Share of off-plan property
89% / 82%
By value and number of residential sales, respectively.
Annual apartment price movement
+20% year on year
Emirate-wide repeat-sales indicator based on subsequent sales of the same properties.
Annual villa price movement
+12% year on year
Emirate-wide repeat-sales indicator based on subsequent sales of the same properties.
Alongside AED 70.4 billion in residential transaction value, expatriate residents and overseas buyers accounted for 70% of total sales value, indicating broad international demand. Off-plan property’s 89% share by value means developer, handover and payment risks must be examined separately; completed-apartment comparisons should not be inferred from whole-market figures.
Sources
Checked: 10 September 2026. Values converted from ft² to m² use a factor of 10.7639. The figures are general market information for the stated period, not a guaranteed return or investment advice. Current prices, costs and terms must always be verified separately.
Area profile
Abu Dhabi generally moves at a steadier pace than Dubai. Cultural development and employment in government and energy contribute to rental demand. Foreign ownership is limited to designated investment zones.
Government and business activity are important sources of demand in this market.
Who might it suit?
Current opportunities
Units and terms change quickly. We check current availability within your budget.